Regular ETF Contributions and Dividend Yield: A Worked Australian Example
Most people don’t invest one lump sum and walk away. They add a little every month, and they care about what their portfolio could be worth down the track. This example uses two of the calculator’s tools, regular contributions and a custom dividend yield, to project the after-tax future value of an ETF and compare it with an offset account, gold and a term deposit.
The inputs
| Assumption | Value |
|---|---|
| Starting amount | $1,000 |
| Regular contribution | $70 a month |
| Total contributed over 10 years | $9,400 |
| Holding period | 10 years |
| Marginal tax rate | 30% |
| Inflation (CPI) | 3.00% |
| Mortgage (offset) rate | 6.50% |
| ETF capital growth | 8.00% p.a. |
| ETF dividend yield (custom) | 4.50% |
| Physical gold growth | 8.00% p.a. |
| Term deposit rate | 5.00% |
| Capital gains tax | 2027 rules (ETF and gold) |
The same $70 is added to every option at the end of each month, so the comparison stays like-for-like. Under the 2027 rules setting, the inflation-adjusted gain is taxed at a minimum of 30% instead of applying the 50% discount.
Step 1: Future value with regular contributions, risk ignored
| Rank | Option | After-tax gain | Estimated final value |
|---|---|---|---|
| 1st | ETF (shares) | $6,068 | $15,468 |
| 2nd | Physical gold | $4,269 | $13,669 |
| 3rd | Offset account | $4,146 | $13,546 |
| 4th | Term deposit | $2,022 | $11,422 |
Final value = $9,400 contributed plus the after-tax gain. Offset final value is cash retained plus mortgage interest avoided.
The year-by-year table in the calculator shows the ETF ahead from the first year and widening its lead as the contributions build. By year 10 it shows $15,468 for $9,400 put in, about $1,920 more than the same money in the offset account.
Step 2: Turn on the risk view
Now apply the calculator’s illustrative risk haircut: each option’s positive gain is multiplied by (10 − risk score) ÷ 10, using the default scores (offset 0, term deposit 1, ETF 4, gold 5).
| Rank | Option | After-tax gain | Multiplier | Risk-view gain |
|---|---|---|---|---|
| 1st | Offset account | $4,146 | ×1.00 | $4,146 |
| 2nd | ETF (shares) | $6,068 | ×0.60 | $3,641 |
| 3rd | Physical gold | $4,269 | ×0.50 | $2,134 |
| 4th | Term deposit | $2,022 | ×0.90 | $1,820 |
Once the ETF’s projected gain is discounted for uncertainty, the guaranteed, tax-free offset saving moves into first place, about $505 ahead.
Step 3: Raise the dividend yield
The dividend yield is one of the levers you can change. Here is what happens to the ETF as the custom yield rises, with everything else unchanged and the risk view on:
| Dividend yield | ETF after-tax gain | ETF risk-view gain | Offset (risk view) | Leader (risk view) |
|---|---|---|---|---|
| 3.80% (ASX 200 default) | $5,764 | $3,459 | $4,146 | Offset |
| 4.50% | $6,068 | $3,641 | $4,146 | Offset |
| 4.85% | $6,224 | $3,734 | $4,146 | Offset |
| 5.50% | $6,519 | $3,911 | $4,146 | Offset |
| 6.00% | $6,752 | $4,051 | $4,146 | Offset |
Dividends are taxed at the 30% marginal rate and reinvested. Franking credits are not modelled.
A higher yield adds to the ETF’s future value every year, but on these assumptions it takes a yield well above the calculator’s ASX 200 default of 3.8% to overturn a guaranteed 6.5% once risk is priced in.
Turn the comparison into a client-ready PDF report
Once the scenario is set up, Print / Save PDF (Advanced) turns it into a clean, printable report. It records every assumption, the final ranking, the year-by-year table and a chart, and a plain-English decision summary. Below is the report for this example with the risk view on and a 4.85% dividend yield.
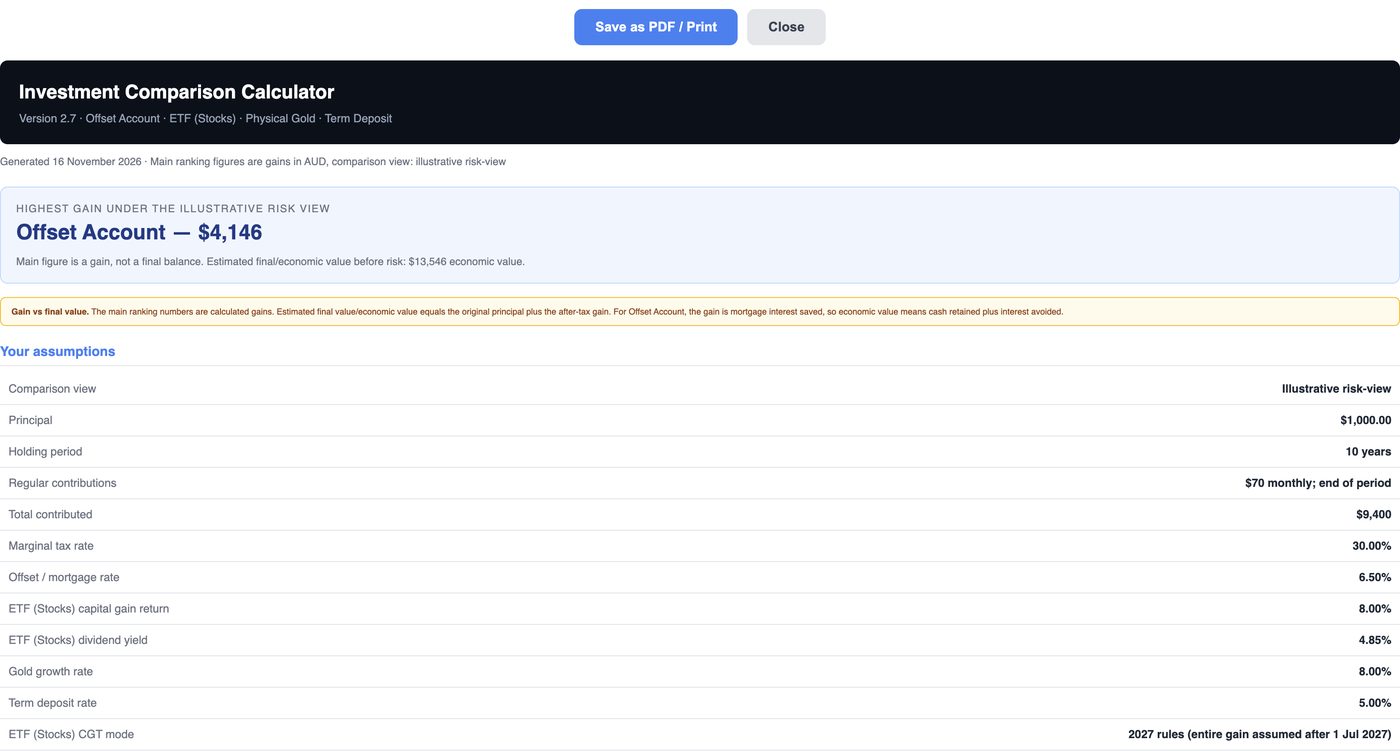
Page 1: the headline result and every assumption used, so the numbers can always be traced back to their inputs.

The ranking table shows after-tax gain, final or economic value and the risk-view gain side by side.
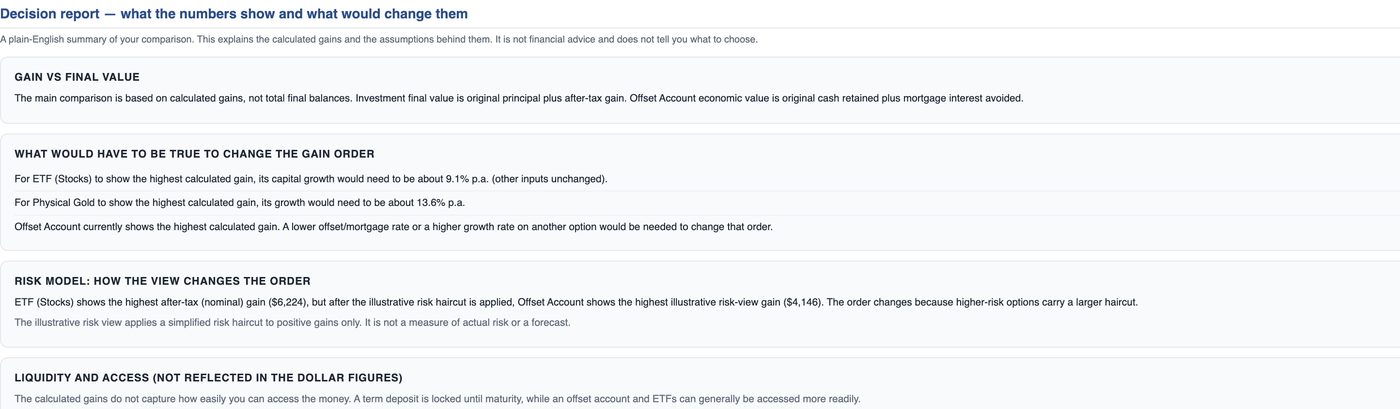
The decision report explains, in plain English, what would have to be true for the ranking to change, such as ETF growth of about 9.1% p.a.
For mortgage brokers and financial advisers
The PDF report is designed to be handed to a client. Run the client’s own numbers in the meeting, adding their regular savings and the yield on the fund they are considering, then save the report and send it with your follow-up email. It gives the client something concrete to take away:
- Their assumptions, in writing. Every input is listed, so there is no confusion later about what was compared.
- A clear before-and-after on risk. The report shows how the order changes once uncertainty is priced in, which is often the most useful conversation to have.
- A neutral framing. The report states that it is an educational comparison, not a recommendation, so it supports the discussion without making the decision for the client.
See using the calculator as a broker or adviser for more on client meetings.
What regular contributions do — and don’t do
- They make the dollars bigger. Without contributions, the same settings give the ETF a lead of about $400 after tax (risk off). With $70 a month, the lead is about $1,920.
- They don’t change the order. Because the same contribution goes into every option, the ranking is set by the return assumptions and the risk setting, not by how much you add.
- They show a realistic future value. Seeing $15,468 from $9,400 contributed is closer to how most people actually invest than a single lump sum.
Things to keep in mind
- Yield and growth tend to trade off. Higher-yielding share funds often have lower capital growth. Raising the yield while keeping growth at 8% may overstate the result.
- The risk haircut is a simplified tie-breaker, not a volatility model. Adjust the scores to reflect your own view.
- Not modelled: franking credits, fees, brokerage, sequencing risk, or the value of keeping cash accessible in an offset.
- Projections, not forecasts. Every figure follows from the inputs above.
Run it with your own numbers
- Open the calculator and enter your starting amount, tax rate, holding period and mortgage rate.
- Tick Add regular contributions and set your monthly or yearly amount (Advanced).
- Choose Custom dividend yield and enter the yield you expect from your fund.
- Read the future value and year-by-year table with the Risk model OFF, then switch it ON.
- Use the Break-even & What-If Analyser to find the growth or yield needed to lead.
- Click Print / Save PDF (Advanced) to keep the result or share it with a client.
Common questions
How much could $70 a month in an ETF grow to over 10 years?
On these assumptions, $9,400 contributed shows an after-tax gain of about $6,068 and a final value of about $15,468. Change the growth, yield or tax rate and the figure changes with it.
Does a higher dividend yield make an ETF beat an offset account?
After tax, the ETF already leads here. Under the risk view it needs a yield of about 6.34% (with 8% growth) to match a 6.5% offset.
Why use the 2027 CGT rules in this example?
Most of a 10-year holding period starting now falls after 1 July 2027, so the 2027 rules setting is a reasonable way to test the result. Switch to the 50% discount to compare. See the 2027 CGT changes explained.
Does this replace financial advice?
No. It is a calculation tool that shows how outcomes respond to assumptions. For decisions that matter, speak to a licensed financial adviser or registered tax agent.